
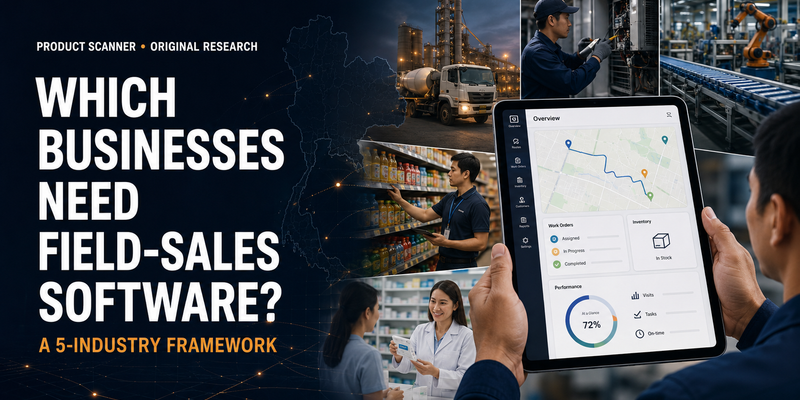
Which Businesses Actually Need Field-Sales Software? A Five-Industry Framework
What a 2019 Thailand market study taught us about identifying companies ready for enterprise mobility software—and what still holds true in 2026.
By Mukul Aggarwal and Monika Saraswat
Field-sales software is easy to demonstrate and surprisingly difficult to sell.
Live location, automated routes, digital orders, inventory visibility and real-time reports all sound useful. Yet usefulness alone does not make a company ready to buy. A business may recognise the advantages and still lack an urgent problem, an internal owner or a measurable financial reason to change.
In 2019, we studied how an enterprise mobility provider could identify suitable customers in Thailand. The project covered three broad product categories: route and van-sales software, sales-force automation and field-service management. Instead of producing another list of companies ranked by revenue, we built a screening framework around operational underperformance.
The central idea was simple:
The best prospect is not necessarily the biggest company. It is the company where a measurable operating problem can be connected to a specific software capability and a decision-maker who owns the outcome.
Seven years later, the terminology and technology have changed. Cloud deployment is more normal, AI is entering scheduling and service workflows, and mobile applications are significantly more capable. But the buying logic remains remarkably similar.
Short answer: which businesses need field-sales software?
Companies are strong candidates for field-sales or field-service software when they have a distributed workforce and suffer from one or more of the following:
-
Poor visibility into inventory, assets or work in progress
-
Slow service-request resolution
-
Excessive travel, fuel or technician downtime
-
Manual order capture and reconciliation
-
Low sales or service productivity
-
Inconsistent compliance records
-
Fragmented customer, sales and operational data
-
Expansion into new territories without scalable processes
These symptoms become meaningful sales opportunities only when they can be measured. “We want to become more digital” is a weak buying signal. “Our technicians complete fewer jobs than the industry norm because dispatching is manual” is a business case.
How we conducted the original research
The 2019 project examined five industry groups in Thailand:
-
Chemical, cement and building materials
-
Facility management and field service
-
Manufacturing
-
Consumer packaged goods and retail
-
Pharmaceuticals
We reviewed public company reports, sector benchmarks, published enterprise-mobility use cases and existing customer patterns. For each industry, we identified operational drivers, proposed measurable qualification criteria and mapped those problems to an appropriate software product and organisational buyer.
We also designed separate questionnaires for customers and salespeople. These covered implementation objectives, hosting preferences, ERP integration, satisfaction, deal-conversion barriers and buying responsibility. The questionnaires were research instruments for subsequent validation; the report did not contain completed survey results.
That distinction matters. This article presents an original analytical framework built from secondary data—not a controlled study proving that a particular software product caused improvements in company performance.
The three questions behind the framework
Before approaching any company, the model asks:
1. Is there a visible operating problem?
The trigger could be declining profitability, slow inventory movement, poor service response, low output per employee or rapid expansion that existing systems cannot support.
2. Can software directly influence the problem?
Not every weak metric is a software problem. Low profitability caused by commodity prices, for example, will not be fixed by a mobile application. But profitability affected by failed deliveries, manual order errors or technician downtime may be addressable.
3. Who owns the metric?
A sales leader may care about order volume and market coverage. An operations leader may own turnaround time, inventory and workforce utilisation. Finance may focus on asset lifecycle and maintenance cost. IT will usually influence integration, security and architecture.
Without a clear owner, even a genuine operational problem can remain an orphaned project.
Five industries—and the signals to look for
| Industry | Strong buying signals | Most relevant software | Likely business owner |
|---|---|---|---|
| Cement and building materials | Poor inventory visibility, rising maintenance costs, low workforce productivity | Route sales and field service | Operations or finance |
| Facility management | Slow requests, missed SLAs, inconsistent job documentation | Field-service management | Operations or service leadership |
| Manufacturing | Excess inventory days, delivery delays, high operating costs | Route, sales and service automation | Operations |
| CPG and retail | Weak inventory turnover, low retail visibility, manual order capture | Van sales and sales-force automation | Sales or operations |
| Pharmaceuticals | Low representative productivity, weak call planning, poor territory visibility | Field-sales and territory management | Sales or commercial operations |
The figures used in the original report reflected the Thai market and available 2019 data. They should not be used as current universal thresholds. The durable value is the method: select a sector-specific metric, establish a defensible benchmark and investigate the companies performing meaningfully below it.
1. Cement and building materials
Companies in cement, chemicals and building materials manage physical inventory, warehouses, vehicles, equipment and dispersed customer locations. The original research highlighted five drivers:
-
Warehouse operations
-
Asset lifecycle
-
Employee productivity
-
Profit margins
-
Maintenance costs
The commercial opportunity emerges when sales and operational teams cannot see the same information. A salesperson may not know available inventory, a customer may receive an unreliable delivery estimate, or maintenance teams may work from outdated asset records.
What to qualify
Look beyond total revenue. Investigate:
-
Inventory accuracy and order-fill rate
-
Warehouse turnaround time
-
Failed or delayed deliveries
-
Maintenance cost per asset or unit of output
-
Revenue or income per field employee
-
Age of the existing ERP and mobile systems
Who to approach
Warehouse and productivity problems usually belong to operations. Asset and maintenance economics may bring finance into the decision. IT becomes essential when the proposal requires integration with ERP, inventory or accounting systems.
2. Facility management and field service
Facility-management companies coordinate technicians, requests, contracts and service-level agreements across multiple customer sites. Their core product is not the software—it is dependable service delivery.
The original framework prioritised:
-
Time required to process a request
-
Technician productivity and non-productive time
-
SLA and safety compliance
-
Real-time operational visibility
-
Customer satisfaction
Modern field-service platforms combine mobile work orders, resource scheduling, customer communication, equipment history and preventative maintenance. Microsoft, for example, describes contemporary field-service systems as combining workflow automation, scheduling algorithms and mobile tools to improve first-time fix rates, reduce travel and provide accurate arrival information. Microsoft Dynamics 365 Field Service overview.
What to qualify
-
Average request-resolution time
-
Percentage of work completed within SLA
-
Jobs completed per technician
-
Repeat visits for the same issue
-
Overtime and travel time
-
Completeness of inspection and compliance records
A company repeatedly missing its service commitments is a stronger prospect than one merely interested in a modern-looking technician app.
3. Manufacturing
Manufacturing creates an unusually broad mobility opportunity because information moves from suppliers to factories, warehouses, transporters, salespeople and customers.
Our 2019 analysis focused on:
-
Time to market
-
Customer satisfaction
-
Operating costs
-
Revenue
-
Operational efficiency
The screening logic was that excess inventory days, slow fulfilment and limited visibility across production and distribution could indicate a need for connected mobile workflows.
What to qualify
-
Raw-material and finished-goods inventory days
-
Order-fulfilment accuracy
-
Downtime and maintenance response
-
Delivery lead time
-
Number of disconnected operational systems
-
Manual data re-entry between field teams and ERP
The diagnosis must remain specific. A factory does not need “mobility” because mobility is fashionable. It may need mobile inventory transactions because warehouse movements are recorded hours later, or field service because machine history is unavailable to technicians.
4. Consumer goods and retail
CPG companies often rely on large distributor networks, field representatives and thousands of retail outlets. Small inefficiencies multiply quickly.
The original framework examined:
-
Inventory turnover
-
Profitability
-
Retailer and consumer engagement
-
Market coverage
-
Time to market
Route-sales and van-sales software can connect route plans, inventory, orders, promotions, collections, returns and end-of-day settlement. Sales-force automation can record outlet visits, availability, merchandising and competitor information.
What to qualify
-
Orders captured manually or through messaging applications
-
Stock-outs and unsold inventory
-
Time between order capture and ERP entry
-
Outlet coverage per representative
-
Unproductive or duplicated visits
-
Promotion execution and merchandising compliance
-
Distributor-level inventory visibility
This sector also demonstrates why one benchmark cannot serve every industry. Grocery, apparel and speciality retail operate with different margins and inventory cycles. Each subcategory needs its own comparison group.
5. Pharmaceuticals
Pharmaceutical field teams require structured call planning, compliant content, territory coverage and accurate reporting from interactions with doctors, pharmacies and distributors.
The 2019 study emphasised:
-
Representative productivity
-
Call management
-
Market coverage
-
Operating costs
-
Real-time access to sales and inventory information
What to qualify
-
Calls or productive interactions per representative
-
Territory coverage and missed accounts
-
Time spent preparing and submitting reports
-
Access to current approved materials
-
Accuracy of distributor and pharmacy inventory information
-
Ability to maintain required records and approvals
Because healthcare data and promotional activity may be sensitive or regulated, security, permissions, auditability and data governance must be treated as product requirements—not procurement paperwork added at the end.
The most useful part: mapping pain to product and buyer
Many B2B sales processes start with the product: demonstrate every module, send a generic proposal and wait for the customer to find something relevant.
Our framework worked in the opposite direction:
| Business problem | Software capability | Primary buyer |
| Poor warehouse visibility | Mobile inventory and route-sales integration | Operations |
| High asset or maintenance cost | Asset history and field-service workflows | Operations or finance |
| Slow service resolution | Scheduling, dispatch and mobile work orders | Service operations |
| Low sales productivity | Territory, visit and order management | Sales |
| Weak retailer engagement | Outlet execution and sales-force automation | Sales or trade marketing |
| Integration or security risk | ERP integration, identity and device controls | IT |
This produces a more credible opening conversation. Instead of asking whether a company wants a mobile solution, the seller can ask how long it takes to allocate a job, reconcile an order or locate the correct part.
Seven prospect filters that still work
The original report proposed several general filters for building a target list. Updated for current use, the strongest are:
1. Performance below a relevant industry benchmark
This could mean slower inventory turnover, lower output per employee, worse SLA performance or higher service costs. The benchmark must come from comparable companies and a recent period.
2. Expansion into new territories
Geographic expansion creates pressure to standardise routes, reporting, inventory and customer data. Companies entering Thailand—or Thai companies expanding regionally—may be more receptive to scalable mobile workflows.
3. An ageing or fragmented technology stack
Long-established companies may have disconnected systems, manual workarounds and heavily customised legacy tools. This can create demand, but it also makes integration and change management harder.
4. A fast-growing field workforce
As employee numbers increase, informal coordination through calls, spreadsheets and chat applications becomes less reliable.
5. A recent operational failure
Missed deliveries, compliance failures, service backlogs or inventory discrepancies can create urgency and executive attention.
6. A new leadership mandate
A new sales, operations or digital-transformation leader may be willing to revisit established processes and systems.
7. Existing budget for ERP, CRM, cloud or data projects
Field software is easier to approve when it supports an already funded transformation programme rather than competing as an isolated application.
What changed between 2019 and 2026?
Cloud is no longer a secondary deployment choice
Our report divided sectors between on-premise and cloud preferences. That question still matters, but the context has shifted. Thailand's digital economy is expanding alongside cloud, AI and data-infrastructure investment, while the World Bank continues to identify interoperability, skills and governance gaps that can limit adoption. World Bank Thailand Digital Data Infrastructure Roadmap.
The buying question is increasingly not simply “cloud or on-premise?” but:
-
Where will operational and personal data be stored?
-
Can the application work offline?
-
How will it integrate with ERP and CRM?
-
Who controls identity, devices and permissions?
-
What happens when connectivity is unreliable?
Offline capability remains important
Better mobile networks have not eliminated dead zones, customer-site restrictions or unreliable connections. Current enterprise field-service products still invest in mobile-offline performance, which confirms that offline workflows are a continuing operational requirement rather than a legacy feature. Microsoft Field Service 2026 release plan.
AI changes the workflow, not the qualification logic
AI can help optimise routes, summarise work orders, recommend technicians and retrieve equipment information. But a company still needs clean data, defined processes and a measurable use case. Automating a poorly understood workflow usually scales the confusion.
Pricing is becoming more modular
The 2019 report reviewed per-user, tiered, feature-based, usage-based, freemium and configurable pricing. These models still exist, often in combination. Buyers should compare total deployment cost rather than the headline licence fee, including:
-
Implementation and configuration
-
ERP or CRM integration
-
Data migration
-
Devices and mobile-data plans
-
Training and adoption
-
Support and customisation
-
Additional environments or storage
How to apply the framework today
Step 1: Choose one industry and one workflow
Do not begin with “all companies employing salespeople.” Start with a narrow workflow such as distributor order capture in CPG or technician dispatch in facility management.
Step 2: Identify three measurable operating indicators
For technician dispatch, those may be response time, jobs completed per technician and repeat visits.
Step 3: Establish a defensible benchmark
Use recent public reports, trade associations, comparable companies or a customer's own historical performance. Do not combine unrelated sectors into a single average.
Step 4: Build the target list
Look for companies below the benchmark, expanding quickly, replacing legacy systems or experiencing a visible operational problem.
Step 5: Map each metric to a capability and owner
If the software cannot plausibly influence the metric, remove that claim. If no executive owns the metric, identify who is accountable before beginning a generic demonstration.
Step 6: Quantify the value
A credible business case might estimate:
-
Hours of administrative work removed
-
Additional service jobs completed
-
Kilometres and fuel saved
-
Failed deliveries prevented
-
Inventory carrying cost reduced
-
Faster order-to-cash cycle
Use conservative assumptions and show the calculation.
Step 7: Validate with interviews
This was the intended next step in our 2019 work. Interview both users and buyers. Field employees reveal workflow friction; managers reveal reporting and control problems; finance and IT expose approval constraints.
What the original research got right
The technology market has changed, but seven conclusions have held up:
-
Operational pain is a stronger targeting signal than company size alone.
-
Industry-specific benchmarks produce better prospect lists than generic filters.
-
The economic buyer depends on the metric being improved.
-
Integration, security and usability influence adoption as much as feature depth.
-
New market entrants and legacy businesses require different propositions.
-
Pricing and deployment must match customer maturity and workflow complexity.
-
A software demonstration is more persuasive when preceded by a quantified diagnosis.
Limitations of the research
This framework should be used as a screening tool, not as proof that software will improve a company's results.
-
The original research was completed in 2019 and focused on Thailand.
-
It relied substantially on public secondary sources.
-
Industry figures came from different companies and reporting periods.
-
The customer and salesperson questionnaires were designed but no completed survey dataset was included.
-
Some benchmarks may reflect association rather than a problem that software can solve.
-
Every shortlisted company still requires direct discovery and financial validation.
Publishing limitations does not weaken original research. It tells readers—and search and AI systems—what the evidence can and cannot support.
Final verdict
The most important question in enterprise software sales is not “Who could use this product?” Almost every distributed business could use some form of mobile workflow.
The better question is: Where is the operational cost of not changing already visible?
Our five-industry study produced a practical answer. Find a measurable problem, compare it with a relevant benchmark, identify the software capability that can influence it and approach the executive who owns the outcome.
That method was useful in Thailand in 2019. With current data, stronger validation and modern product language, it remains useful in 2026.